Some analysts are predicting that the price of Bitcoin may be in the range of $18,700 to $19,200 by the end of January 2023. However, it is important to note that these are only predictions and there is no way to know for certain what the price of Bitcoin will be.

Bitcoin Price Prediction
It is also possible that the price of Bitcoin may drop to a minimum of $10,000 in 2023. It is important to keep in mind that the value of cryptocurrencies can be highly volatile and can fluctuate significantly in a short period of time. It is always a good idea to do your own research and consult with a financial advisor before making any investment decisions.
CryptoAmsterdam Analyst
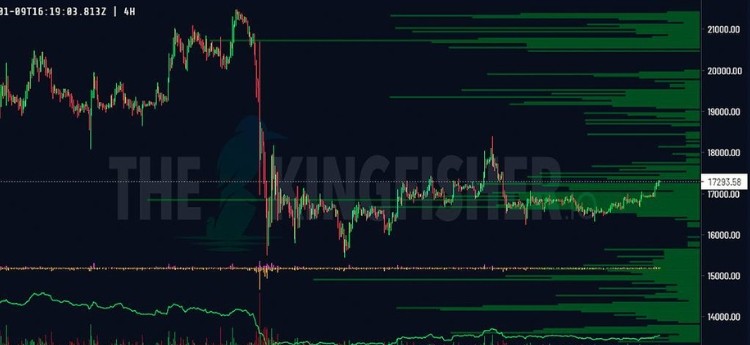
🧐 Opinion — The purple marker indicates a key zone to pay attention to. At the moment, the price is at $17,282 resistance, from which it could potentially start falling (though a short-term increase to $17,400 is not out of the question as long as the price stays under $17,282). If the price falls, it could potentially reach a dynamic support where the seller may try to test the trend line for resistance. This could be a strong signal for the continuation of the downward movement. Alternatively, the price could move upwards to the $18,000-$18,400 block.
📢 Commentary — It is worth noting that BTC is currently performing well, with short sellers potentially contributing to the downward momentum. However, given the current funding, it is important to be cautious and not overestimate the risks. It is also possible that the price could increase to the range of $18,700-$19,200. For now, it is important to watch how the seller reacts when the price reaches $17,600.
Bitcoin Liquidity Map

The Kingfisher Bitcoin Liquidity Map — is a tool that allows users to see areas where a high density of liquidations is likely to occur. These are areas of high liquidity, fast price action, and confusion for traders who are not expecting them.
The Kingfisher Map can be used to trade in a breakout style or to scalp profits. Some users have reported finding the platform useful for watching market behavior and trading or scalping using the liquidation maps and CVD divergences. It appears that the Kingfisher Bitcoin Liquidity Map is only available on the platform thekingfisher.io. It is not clear whether the Kingfisher also offers maps for other cryptocurrencies.
- ⏱️ Timeframe: 4H
- ⚡ Cryptocurrency exchanges that are included in the chart: Binance, Bitfinex, OKX, ByBit, Bitmex, Bitget
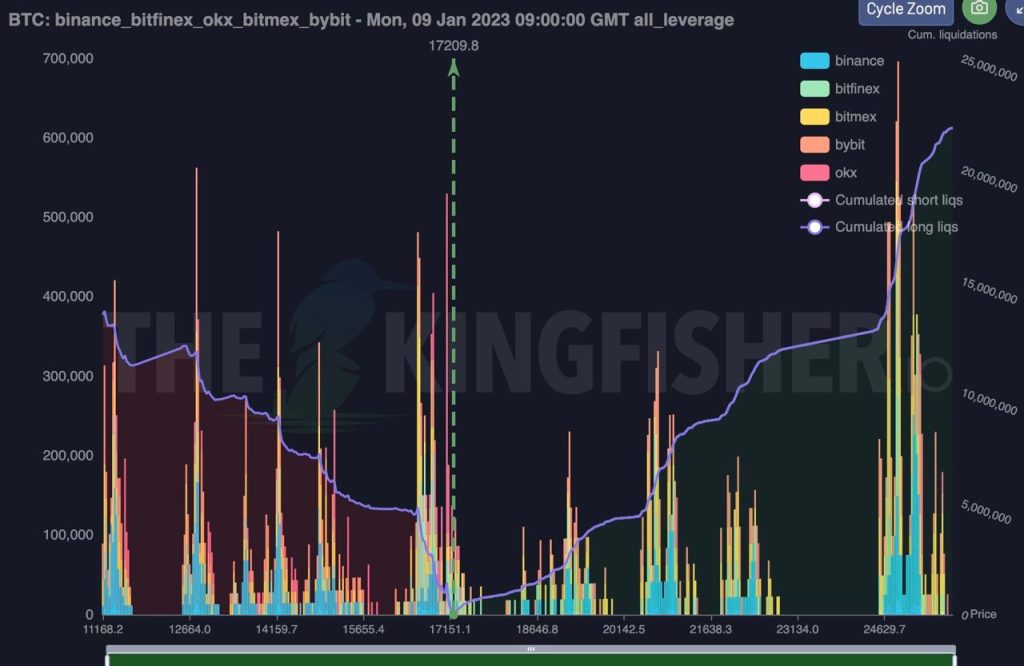
📢 Commentary — The X indicator is being processed. Bitcoin is making progress towards achieving its goals. As mentioned in a previous post, the first target range of $17,200-17,400 has been achieved. The second target is the $17,600 level. According to the Kingfisher analysis, there is a cluster in the $17,400-17,700 range. The highest concentration of liquidity is at the bottom, in the $17,200-16,500 range. Please exercise caution.
Currently, the liquidity map looks like this:
- Upper clusters: $17,400-17,700, $18,600-20,000, and $20,450-21,400.
- Lower clusters: $17,200-16,500, $15,600-14,400, and $14,300-13,400.

Tribesigns U Shaped Computer Desk with Hutch, 74.8 Inches Gaming Desk with Monitor Stand Shelf, Black Gamer Command Center Workstation Desk for Gaming (Black)
$205.99

Cubiker Computer Desk 63 inch Home Office Writing Study Desk, Modern Simple Style Laptop Table with Storage Bag, Black
 Recommended reading: 5 Tips for Beginner Bitcoin Traders

(Image credit: logll.com)
JACKIS Analyst
🧐 Opinion — The price is entering the red zone, and we should observe where the sellers become active. This movement is likely a “retest” for the continuation of the bear market.
I will only consider a bullish scenario if the price breaks above the $17,600 level and holds above it. If this occurs, the first target will be $18,000.
📢 Commentary — We are currently on track. Bitcoin has achieved the first target range of $17,200-17,400, which could potentially mark the start of a reversal. The next potential area of growth is at $17,600. Overall, we are anticipating a decline to $16,000.
Recommended reading: How to Trade Bitcoin with ByBit?

(Image credit: logll.com)
Recommended reading: Best Hardware Wallets for Bitcoin

(Image credit: logll.com)
We publish our latest Logll Tech News via Telegram and Twitter.
Subscribe to receive our latest updates in your inbox!